LandscapeDNDC 1.37.0
Loading...
Searching...
No Matches
figures Namespace Reference

Functions

 build_parent_map (root=xmlparameters)
 
 find_species (root, mnemonic)
 
 _get_from_default (root, name_lower)
 
 get_par (name, species_mnemonic, root=xmlparameters, parent_map=parent_map)
 
 get_par (_name, _type='mean')
 Helpers.
 
 weibull (_x, _p1, _p2, _p3=1.0)
 Response functions.
 
 get_par_range (_name)
 
 plot_response_row (_ax, _func, _x, _names, _xlabel, _ylabel, _xlim=None, _ylim=None, _legend=False)
 
 plot_response (_filename, _func, _x, _names, _xlabel, _ylabel, _xlim=None, _ylim=None, _legend=False, _adjust=None)
 
 plot_single (_filename, _func, _x, _xlabel, _ylabel, _xlim=None, _ylim=None)
 
 ph_logistic (_x, _ph_50, _width)
 
 ph_bell (_x, _half_width, _exponent, _ph_opt)
 
 ph_cutoff (_fact)
 
 get_par (_name, _xml)
 Helpers.
 

Variables

 fig = plt.figure( figsize=(7, 4))
 zs = np.array([temp(x, t1, t2) * weibull(y, w1, w2, w3) for x,y in zip(np.ravel(X), np.ravel(Y))]) zs = np.array([2.0 / (1.0/temp(x, t1, t2) + 1.0/weibull(y, w1, w2, w3)) for x,y in zip(np.ravel(X), np.ravel(Y))]) Z = zs.reshape(X.shape)
 
 _xlim
 Microbial processes.
 
 _ylim
 Nitrification.
 
 p_mix = get_par('METRX_F_PERTUBATION_MIX')
 Bioturbation (D_eff_dailyturbation_sl) response factors (constants are hard-coded in soilchemistry-metrx-physics-chemistry.cpp)
 

Detailed Description

Response functions of MeTrX plotted for the doxygen documentation.

Parameter values (mean, min, max) are read from resources/parameters-site.xml,
figures are written to ../figures/.

Function Documentation

◆ _get_from_default()

figures._get_from_default ( root,
name_lower )
protected
Fallback: get parameter from species mnemonic='none'.
28def _get_from_default(root, name_lower):
29 """Fallback: get parameter from species mnemonic='none'."""
30 default_species = find_species(root, 'none')
31 if default_species is None:
32 return None # or raise
33
34 for elem in default_species.findall('par'):
35 if elem.attrib.get('name', '').lower() == name_lower:
36 return float(elem.attrib['value'])
37 return None
38

References find_species().

Referenced by get_par().

Here is the call graph for this function:
Here is the caller graph for this function:

◆ build_parent_map()

figures.build_parent_map ( root = xmlparameters)
Build a dict: child_element -> parent_element.
16def build_parent_map(root=xmlparameters):
17 """Build a dict: child_element -> parent_element."""
18 return {child: parent for parent in root.iter() for child in parent}

References build_parent_map().

Referenced by build_parent_map(), and get_par().
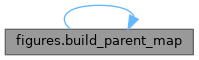
Here is the call graph for this function:
Here is the caller graph for this function:

◆ find_species()

figures.find_species ( root,
mnemonic )
Return the first <species> element with the given mnemonic.
21def find_species(root, mnemonic):
22 """Return the first <species> element with the given mnemonic."""
23 for node in root.iter('species'):
24 if node.attrib.get('mnemonic') == mnemonic:
25 return node
26 return None
27

Referenced by _get_from_default(), and get_par().

Here is the caller graph for this function:

◆ get_par() [1/3]

figures.get_par ( _name ,
_type = 'mean' )

Helpers.

Return value ('mean'), 'min' or 'max' of a site parameter.
18def get_par( _name, _xml) :
19 for elem in _xml :
20 if elem.attrib.get( 'name').lower() == _name.lower() :
21 return float(elem.attrib.get( 'value', ''))
22 return None
23

◆ get_par() [2/3]

figures.get_par ( _name,
_type = 'mean' )

Helpers.

Return value ('mean'), 'min' or 'max' of a site parameter.
18def get_par( _name, _xml) :
19 for elem in _xml :
20 if elem.attrib.get( 'name').lower() == _name.lower() :
21 return float(elem.attrib.get( 'value', ''))
22 return None
23

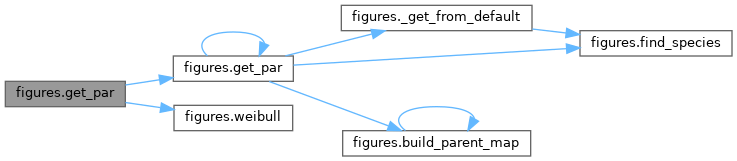
References get_par(), and weibull().

Here is the call graph for this function:

◆ get_par() [3/3]

figures.get_par ( name,
species_mnemonic,
root = xmlparameters,
parent_map = parent_map )
name: parameter name (string), e.g. 'aejm'
species_mnemonic: e.g. ':corns:' or ':poaceae:'
root: root <speciesparameters> element
parent_map: optional precomputed parent map (for efficiency)
39def get_par(name, species_mnemonic, root=xmlparameters, parent_map=parent_map):
40 """
41 name: parameter name (string), e.g. 'aejm'
42 species_mnemonic: e.g. ':corns:' or ':poaceae:'
43 root: root <speciesparameters> element
44 parent_map: optional precomputed parent map (for efficiency)
45 """
46 if parent_map is None:
47 parent_map = build_parent_map(root)
48
49 name_lower = name.lower()
50
51 # 1. Find requested species node
52 species_node = find_species(root, species_mnemonic)
53 if species_node is None:
54 # if the species doesn't exist at all, skip to default
55 return _get_from_default(root, name_lower)
56
57 # 2. Walk up the hierarchy: species -> parent species -> ...
58 current = species_node
59 while current is not None and current.tag == 'species':
60 for elem in current.findall('par'):
61 if elem.attrib.get('name', '').lower() == name_lower:
62 return float(elem.attrib['value'])
63 current = parent_map.get(current)
64
65 # 3. If not found, try the default species mnemonic="none"
66 return _get_from_default(root, name_lower)
67
68

References _get_from_default(), build_parent_map(), find_species(), and get_par().

Referenced by get_par(), get_par(), and get_par_range().
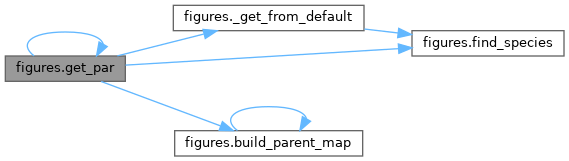
Here is the call graph for this function:
Here is the caller graph for this function:

◆ get_par_range()

figures.get_par_range ( _name)
Return dictionary with mean, min and max of a site parameter.
33def get_par_range(_name):
34 """Return dictionary with mean, min and max of a site parameter."""
35 return {t: get_par(_name, t) for t in ('mean', 'min', 'max')}
36

References get_par().

Referenced by plot_response_row().
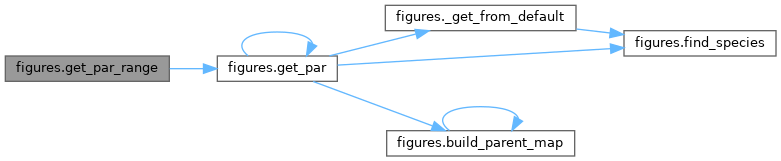
Here is the call graph for this function:
Here is the caller graph for this function:

◆ ph_bell()

figures.ph_bell ( _x,
_half_width,
_exponent,
_ph_opt )
MeTrX_get_fact_ph_bell (arguments in order of site parameters _1, _2, _3).
109def ph_bell(_x, _half_width, _exponent, _ph_opt):
110 """MeTrX_get_fact_ph_bell (arguments in order of site parameters _1, _2, _3)."""
111 return 1.0 / (1.0 + (abs(_x - _ph_opt) / _half_width)**_exponent)

◆ ph_cutoff()

figures.ph_cutoff ( _fact)
Processes with pH response below FACT_PH_MIN are not calculated (SoilChemistryMeTrX::FACT_PH_MIN).
113def ph_cutoff(_fact):
114 """Processes with pH response below FACT_PH_MIN are not calculated (SoilChemistryMeTrX::FACT_PH_MIN)."""
115 return _fact if _fact >= FACT_PH_MIN else 0.0

References plot_response().

Here is the call graph for this function:

◆ ph_logistic()

figures.ph_logistic ( _x,
_ph_50,
_width )
MeTrX_get_fact_ph_logistic: increasing with pH for _width > 0, decreasing for _width < 0.
106def ph_logistic(_x, _ph_50, _width):
107 """MeTrX_get_fact_ph_logistic: increasing with pH for _width > 0, decreasing for _width < 0."""
108 return 1.0 / (1.0 + math.exp(-(_x - _ph_50) / _width))

◆ plot_response()

figures.plot_response ( _filename,
_func,
_x,
_names,
_xlabel,
_ylabel,
_xlim = None,
_ylim = None,
_legend = False,
_adjust = None )
Plot response with sensitivity to each parameter (see plot_response_row) and save figure.
78 _xlim=None, _ylim=None, _legend=False, _adjust=None):
79 """Plot response with sensitivity to each parameter (see plot_response_row) and save figure."""
80 n = len(_names) + 1
81 fig, ax = plt.subplots(1, n, figsize=(5*n, 4))
82 plot_response_row(ax, _func, _x, _names, _xlabel, _ylabel, _xlim, _ylim, _legend)
83 if _adjust is not None:
84 plt.subplots_adjust(**_adjust)
85 save(_filename)
86

References plot_response_row().

Referenced by ph_cutoff().

Here is the call graph for this function:
Here is the caller graph for this function:

◆ plot_response_row()

figures.plot_response_row ( _ax,
_func,
_x,
_names,
_xlabel,
_ylabel,
_xlim = None,
_ylim = None,
_legend = False )
Plot _func(x, *parameters) on a row of axes.

The first panel shows the response with all parameters at their mean value.
Each further panel varies one parameter between min (blue), mean (black) and
max (red) while the other parameters are kept at their mean value.
49def plot_response_row(_ax, _func, _x, _names, _xlabel, _ylabel, _xlim=None, _ylim=None, _legend=False):
50 """Plot _func(x, *parameters) on a row of axes.
51
52 The first panel shows the response with all parameters at their mean value.
53 Each further panel varies one parameter between min (blue), mean (black) and
54 max (red) while the other parameters are kept at their mean value.
55 """
56 pars = [get_par_range(name) for name in _names]
57 means = [p['mean'] for p in pars]
58
59 _ax[0].plot(_x, [_func(x, *means) for x in _x], colors['mean'])
60 _ax[0].set_title('\n'.join(f"{n}: {p['mean']}" for n, p in zip(_names, pars)), fontsize=8)
61
62 for k, par in enumerate(pars):
63 ax = _ax[k+1]
64 for t in ('mean', 'min', 'max'):
65 values = list(means)
66 values[k] = par[t]
67 ax.plot(_x, [_func(x, *values) for x in _x], colors[t],
68 label=None if t == 'mean' else str(par[t]))
69 ax.set_title('\n'.join(f"{n}: [{p['min']}, {p['max']}]" if i == k else f"{n}: {p['mean']}"
70 for i, (n, p) in enumerate(zip(_names, pars))), fontsize=8)
71 if _legend:
72 ax.legend()
73
74 for ax in _ax:
75 format_axes(ax, _xlabel, _ylabel, _xlim, _ylim)
76

References get_par_range().

Referenced by plot_response().

Here is the call graph for this function:
Here is the caller graph for this function:

◆ plot_single()

figures.plot_single ( _filename,
_func,
_x,
_xlabel,
_ylabel,
_xlim = None,
_ylim = None )
Plot response without parameter variation and save figure.
87def plot_single(_filename, _func, _x, _xlabel, _ylabel, _xlim=None, _ylim=None):
88 """Plot response without parameter variation and save figure."""
89 fig, ax = plt.subplots(1, 1, figsize=(5, 4))
90 ax.plot(_x, [_func(x) for x in _x])
91 format_axes(ax, _xlabel, _ylabel, _xlim, _ylim)
92 save(_filename)
93
94

Variable Documentation

◆ _xlim

figures._xlim
protected

Microbial processes.

Methane production and oxidation.

Decomposition and humification.

Denitrification.

◆ _ylim

figures._ylim
protected

Nitrification.

Anaerobic volume fraction and pore connectivity.

◆ fig

figures.fig = plt.figure( figsize=(7, 4))

zs = np.array([temp(x, t1, t2) * weibull(y, w1, w2, w3) for x,y in zip(np.ravel(X), np.ravel(Y))]) zs = np.array([2.0 / (1.0/temp(x, t1, t2) + 1.0/weibull(y, w1, w2, w3)) for x,y in zip(np.ravel(X), np.ravel(Y))]) Z = zs.reshape(X.shape)

ax.plot_surface(X, Y, Z, cmap="winter", rstride=1, cstride=1) ax.set_title('Temperature-moisture factor') ax.set_xlabel('T [oC]') ax.set_ylabel('wfps [-]') ax.set_zlabel('response [-]') plt.savefig(script_dir+"/../figures/temp_moist.png")